Google Analytics is a very useful tool for gaining insight into which pages on your website are performing well, so that you can respond to this with the...
A KPI indicator shows in a visual way what the current state of your KPI is. This blog describes how you can do this...
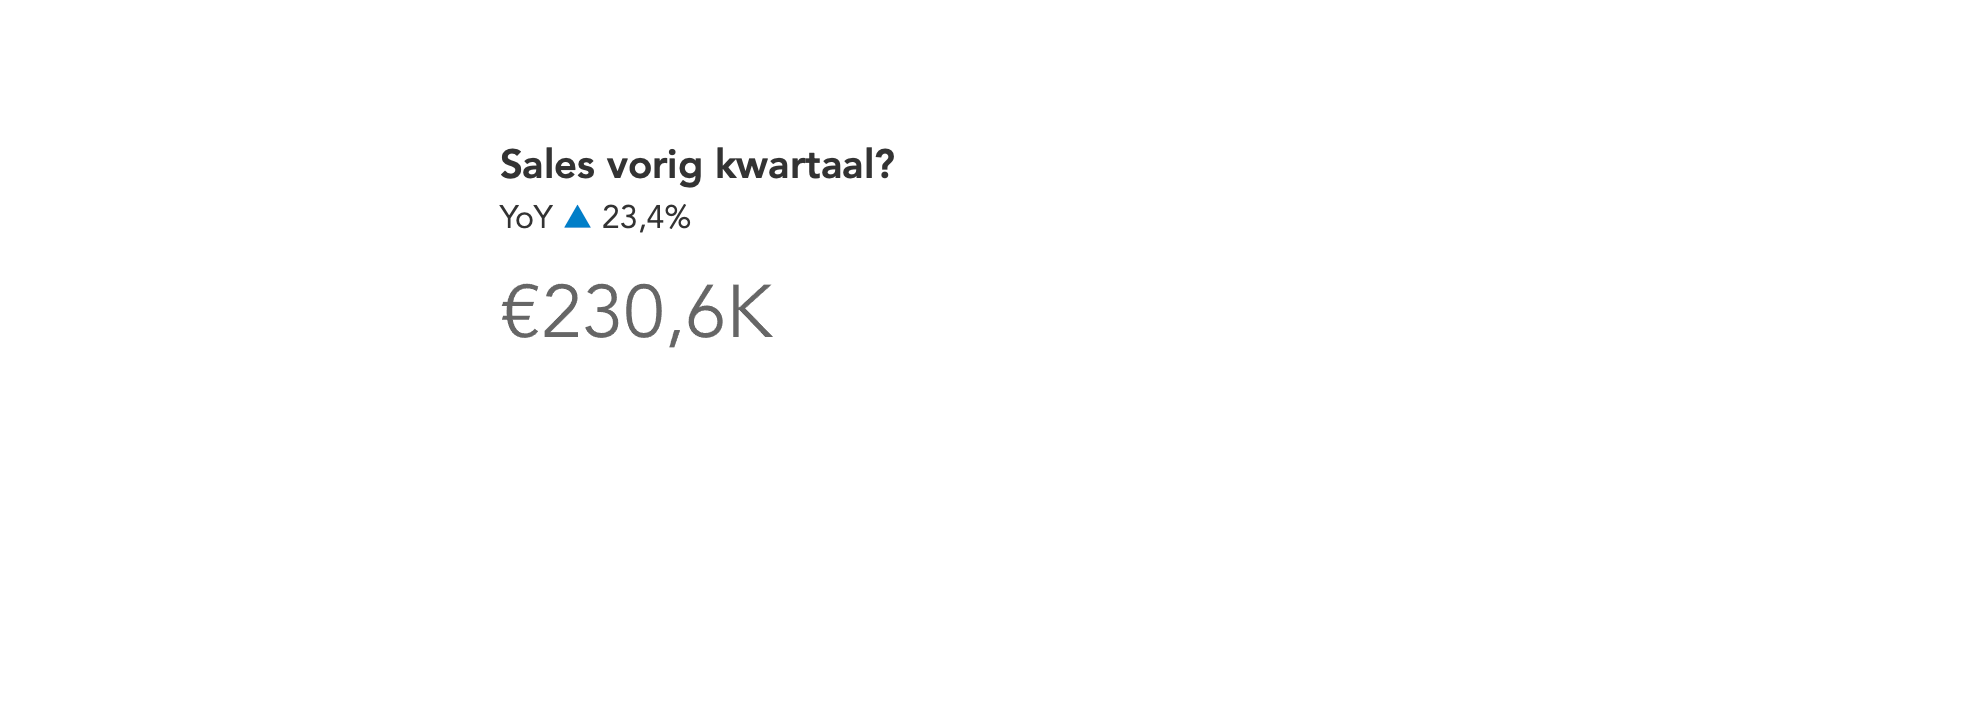
The use of a KPI indicator can be a very useful visual tool to indicate whether your KPI, key performance indicator, has gone up or down. For this...
Put some spice into your Tableau dashboard by embedding a web page object into your dashboard and a URL action to hyperlink to additional web-based information on the user's...
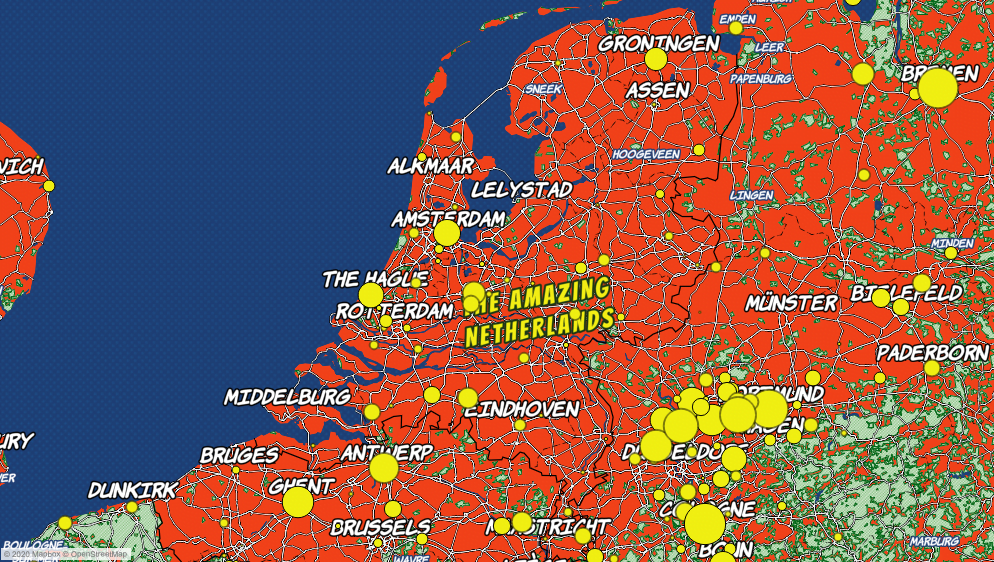
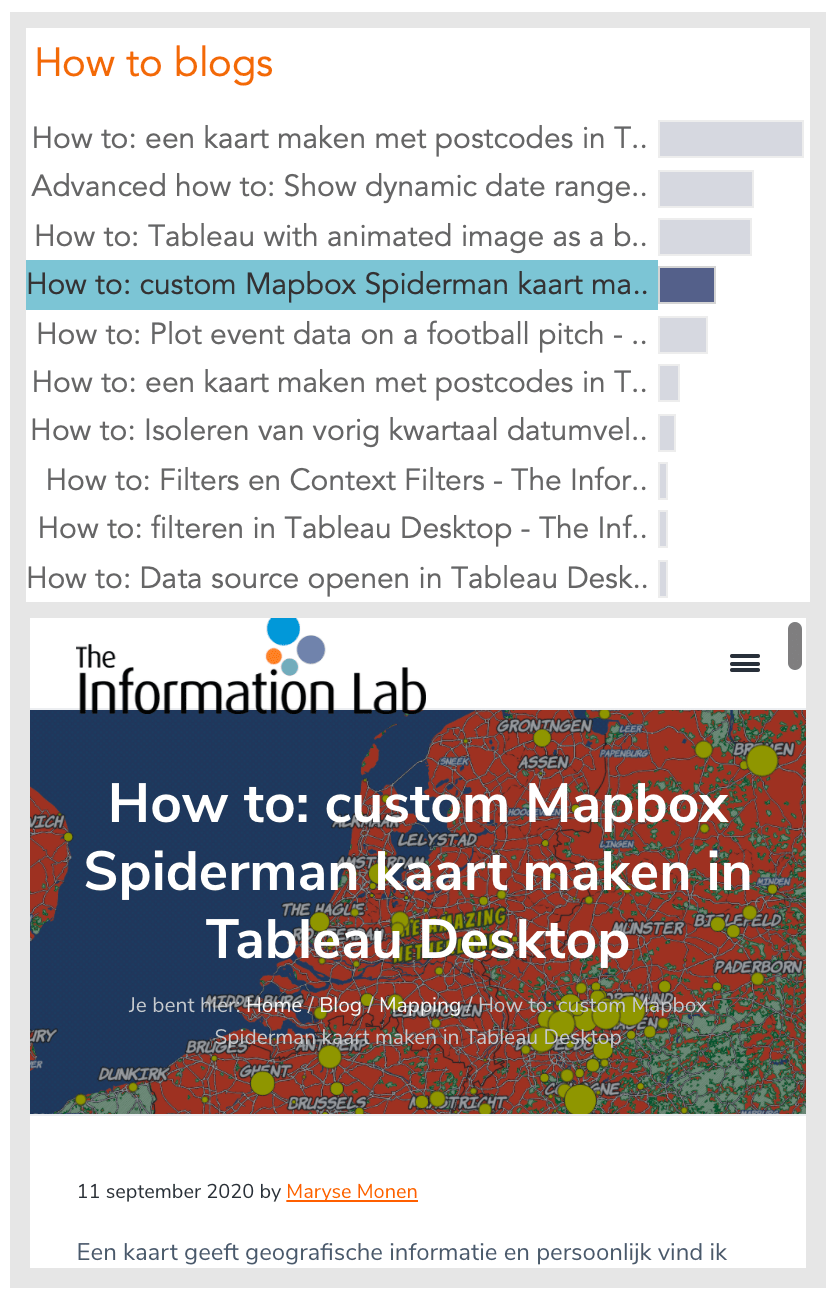
A map provides geographical information, and personally I find maps very interesting to look at as well. It is visual, and grabs your attention immediately. Although I find the...

Are you also in love with Modern User Interface design? Then this blog post might be right for you! While following a webinar by the amazing Tableau Zen Master Chantilly...
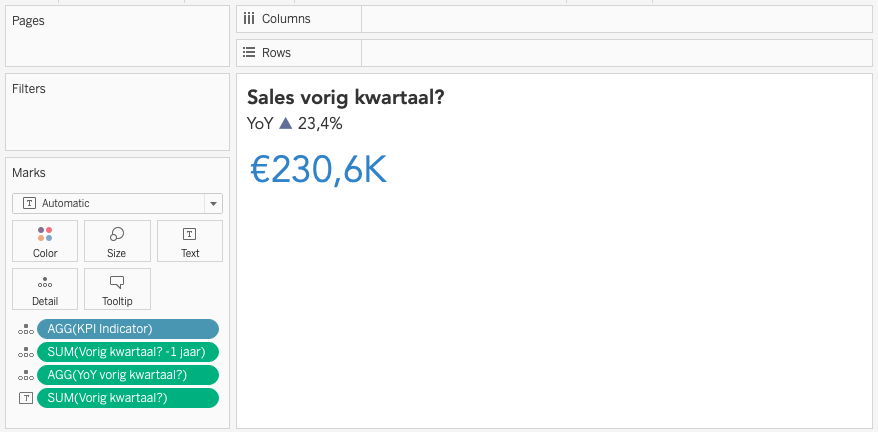
How do you calculate the YoY (Year over Year) of two numbers in Tableau Desktop? In my previous blog, you can read how to isolate a period from your...

To isolate a period from your dataset, you can use a filter. You select the date field, choose the quarter and drag it to the filter. Sometimes you want to...
One of our customers recently asked us how to make their dashboard open on the current week. "My data" they specified "contains future dates too. I would like to make...