
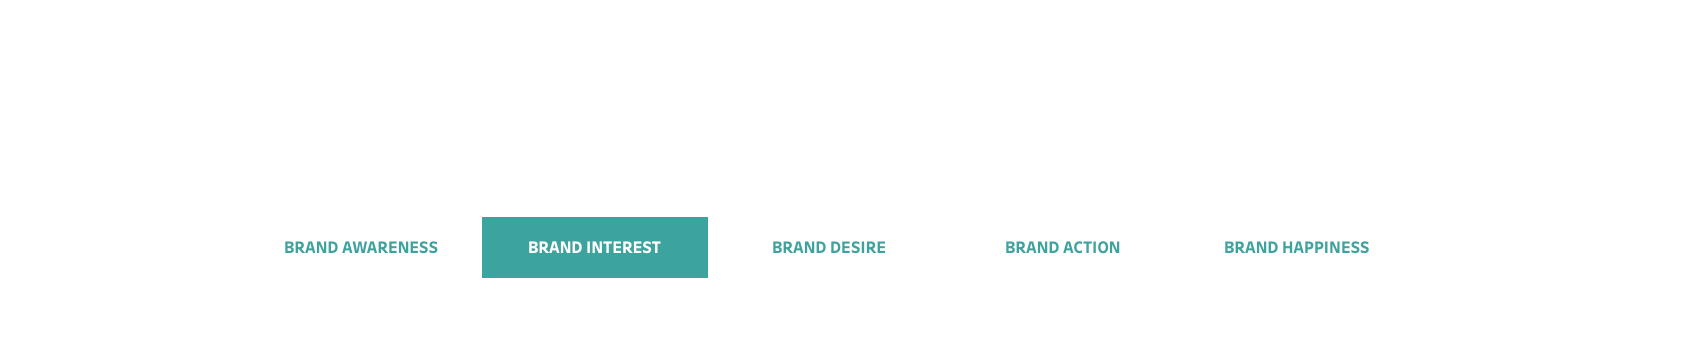
In your dashboards, you often find that it’s a bit too cluttered … You don’t know where to put the legend or the filters? Or you would like to...
Dashboards are located in a place between data and design. The objective of a dashboard is to allow users to learn something about their data and take decisions. So...
Before talking about Month-over-Month in Alteryx let’s take a step back. What is Month-over-Month (MoM)? MoM growth shows the change in the value of a metric as a percentage...
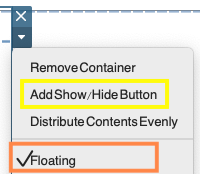
What’s your UI design problem? You want to present the end-user with different groups of charts that fall into distinct categories, but displaying everything on one view would the...
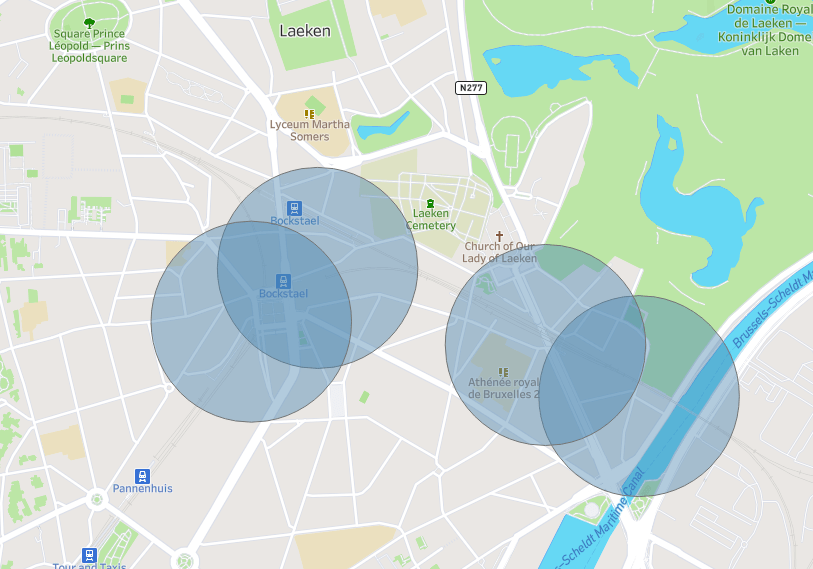
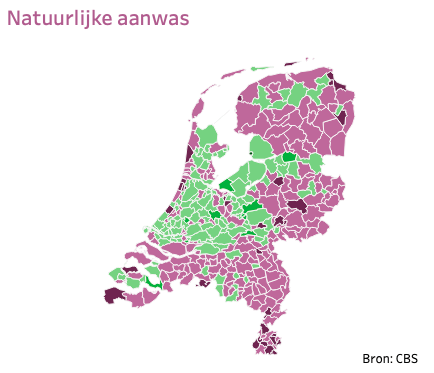
Last year, Tableau introduced three spatial functions: Makepoint and Makeline (2019.2) and then Distance (2019.3). Then the spatial buffer calculation was released with Tableau 2020.1 and allows us to...
Put some spice into your Tableau dashboard by embedding a web page object into your dashboard and a URL action to hyperlink to additional web–based information on the user’s...
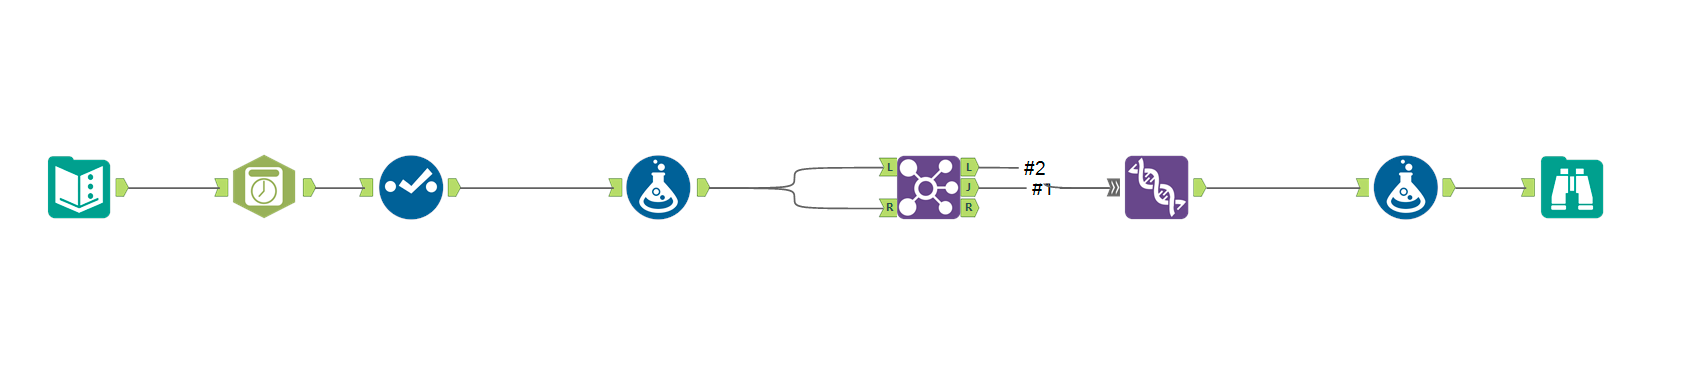
Recently Alteryx 2020.2 has been released to the public. This new version brings a series of great new features: Alteryx Intelligence Suite, AMP and many new tools functions. Here...
The new version of Alteryx has just been released, let’s go for a quick summary! Data Profiling Data Profiling is what you see when you drag a Browse Tool...
The Tokenize is one of the four output methods of the Regular Expression tool. Thanks to this method you can specify a regular expression that will be parsed into...