
Aside from the great documentation available for Snowflake users, there aren't any dedicated challenges to helps us in further developing our Snowflake skills. Luckily, there is a new kid...
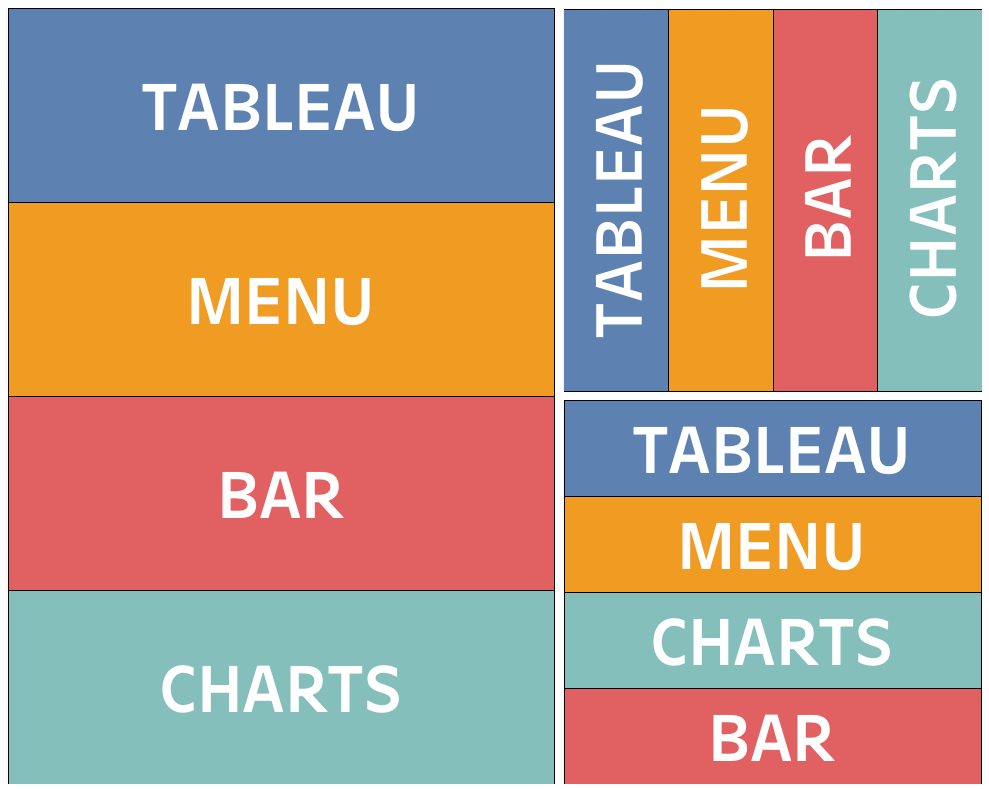
Tableau Menu Bar Charts Discover how to make Tableau Menu Bar Charts Tableau Dashboards can be made more interactive by adding buttons. While there are a few options to...
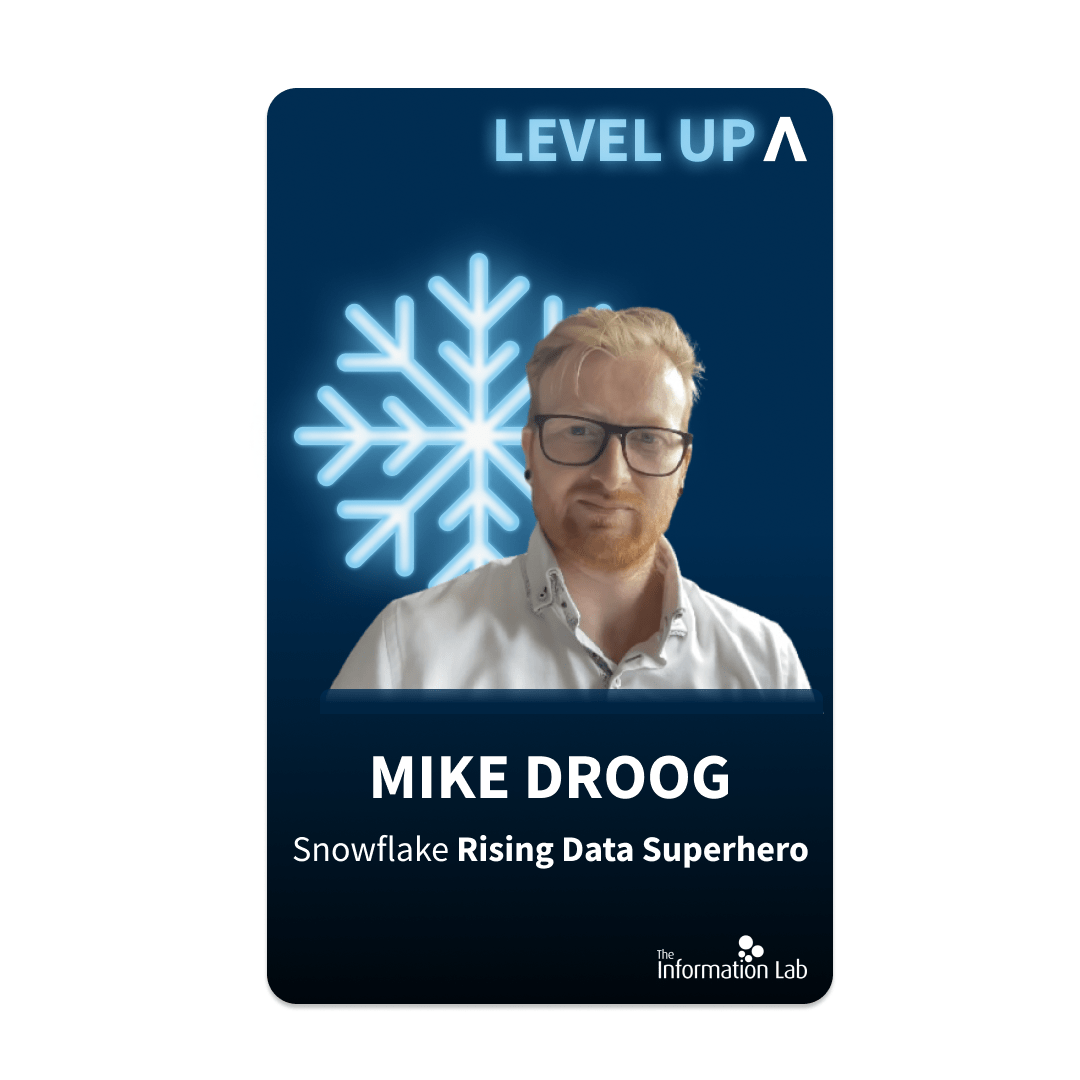
College Mike Droog has been nominated by Snowflake as a Rising Data Superhero (as 1 of 9 suggested candidates!). Super cool and quite an honor, but what exactly is that a...
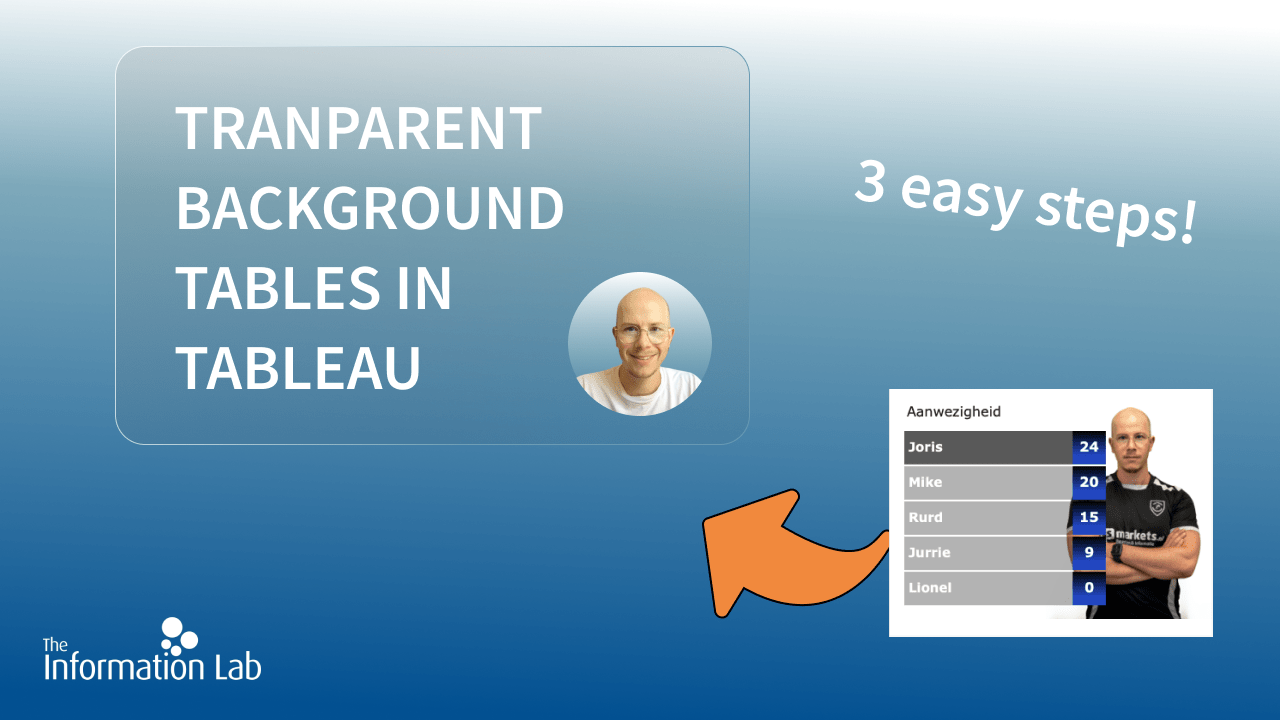
It was quite a thing in 2018: transparent worksheets in Tableau. A cool feature that allows you to superimpose your visualizations over other images. Still, I ran into...

What's going to happen. Between Aug. 9 and Sept. 30, Tableau Cloud (formerly: Online) is going to enforce the MultiFactor Authentication (MFA) requirement for all users. This means that logging in with only...
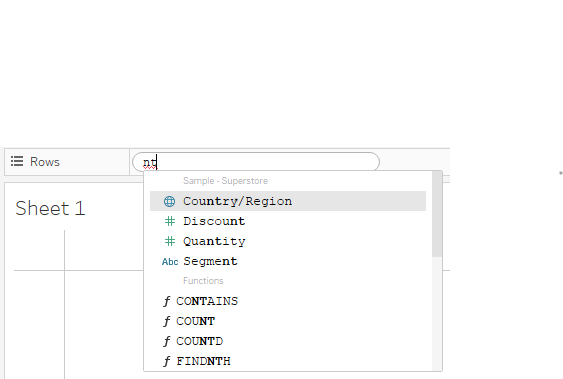
Substring Autocompletion in Tableau Tableau is great at drag-and-drop. This is one of the reasons it is so intuitive to use: visualizations are created in no time just by...

The Women's European Championship 2022 kicked off last week in England. Together with Gracenote, our very own Halftime Heroes have created visualizations on the historical performances and predictions of the participants....
Working with Dates in Tableau can get confusing at the start. Especially when it comes to working out the difference between date parts and date values, (the difference between...

It was my dream as a soccer, Tableau and data enthusiast: a live Premier League Dashboard that updates daily with the latest results. The best matches, results and players automatically...