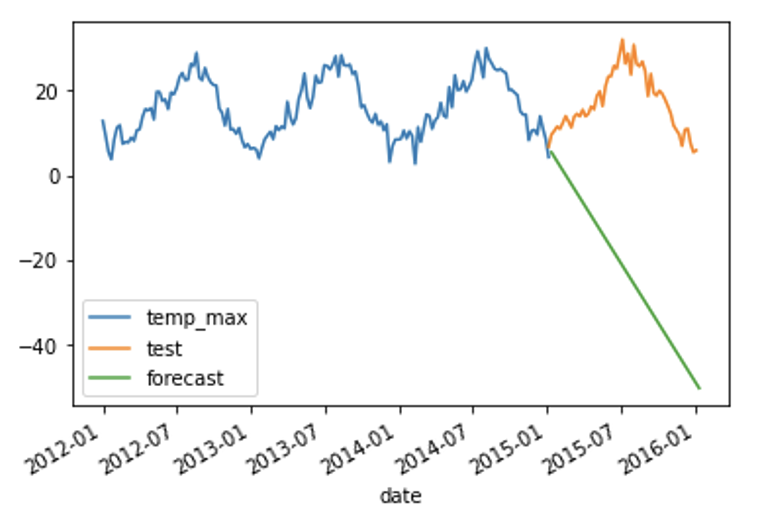
Time series data is a collection of data points recorded over time, that are used to analyze trends and patterns in a specific variable. This type of data is...
To convince people that data visualization is better than tables, it is important to highlight the benefits of visual representation. In this blog, we provide a...
We often get the following question at The Information Lab: What strategy should I use to make my organization data-driven? Data-driven organizations are those that use...

Suppose you have a number of dashboards, all in the same workbook. Now you want to modify a calculated field. That's easy, of course: You modify the calculation, and voila,...

This is the second blog on creating a hidden hierarchy without a plus/min button, the first blog can be found here. The third blog is through this...
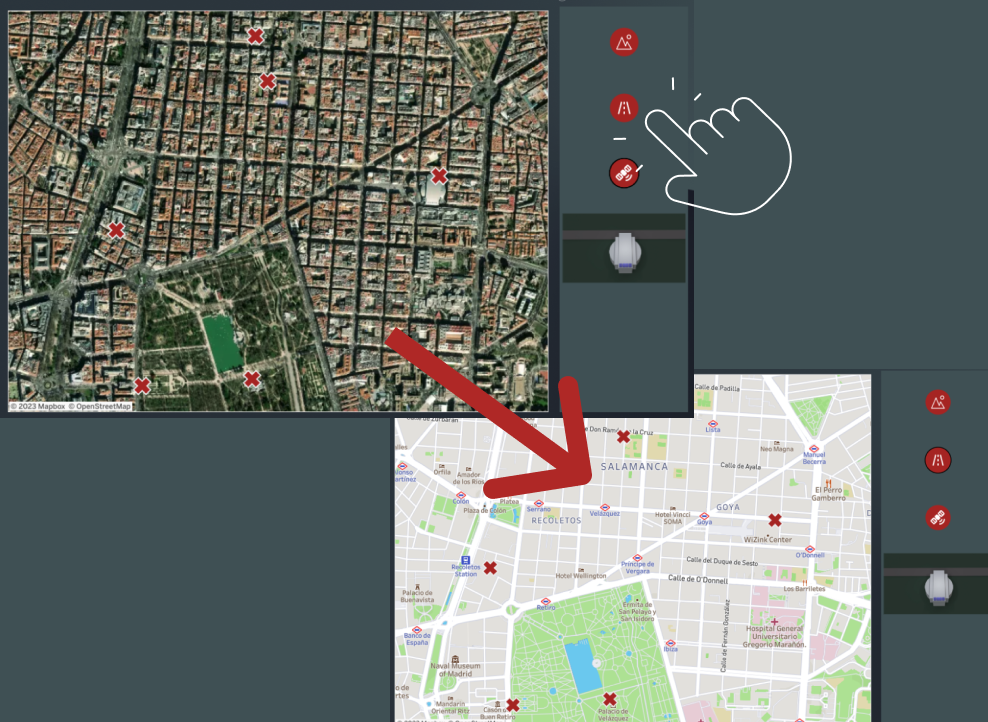
Introduction Tableau is a powerful data visualization tool used by organizations around the world. A new, lesser-known feature in Tableau is the Dynamic Zone Visibility feature. This...
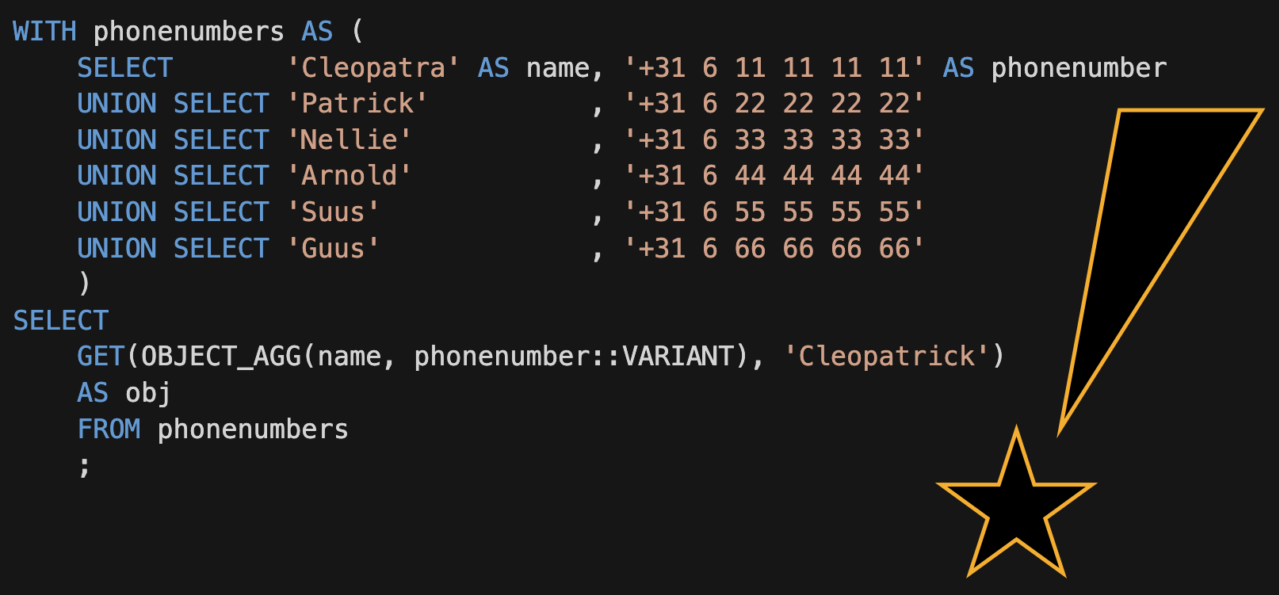
Creating and querying a Snowflake semi-structured OBJECT Snowflake has a lot of features. One very handy feature is that it can handle semi-structured data natively. This can be done...

Predictive Analytics using Machine Learning Algorithms Part 1: Selecting and preparing your data Welcome to the first blog of this predictive data analytics and machine learning series. During this...

How do you keep the departments of HR, who wants to see hours worked by month, and Finance, who wants to see everything with ISO? In other words, how do I get hours worked in months and...