Hoe bereken je het Percent of Total als je data gefilterd is in Tableau Desktop? Wanneer je gebruik maakt van een Table Calculations zoals Percent of Total in Tableau...

This week, a customer asked for advice on how to convert seconds into HH:MM:SS in Tableau. They had created their seconds field by using a datediff calculation (that is,...
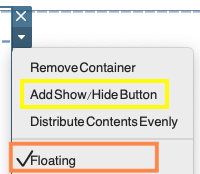
In your dashboards, you often find that it’s a bit too cluttered … You don’t know where to put the legend or the filters? Or you would like to...

Working with filters and FIXED Level of Details Calculations (LODs) in the same view can be challenging. This is due to Tableau’s order of operations. In general, if something...
Dashboards are located in a place between data and design. The objective of a dashboard is to allow users to learn something about their data and take decisions. So...
Before talking about Month-over-Month in Alteryx let’s take a step back. What is Month-over-Month (MoM)? MoM growth shows the change in the value of a metric as a percentage...

This week, I learned how to create a pattern bar chart (also known as textured bar chart or pattern-filled bar chart). My colleague Emma and I were looking into...
Would you like to get rid of the space between title and sheet on your Tableau dashboard? Follow this blog to achieve your goal. Here is the situation: while...

What’s your UI design problem? You want to present the end-user with different groups of charts that fall into distinct categories, but displaying everything on one view would the...