
In today’s fast-paced business environment, data is a critical asset that can make or break an organization’s success. To get the most value out of data, companies need to...

What is The Book Club? Welcome to The Book Club! The goal of this book club is to provide valuable insights and perspectives on books related to data, visualisation,...
Het implementeren van self-service analytics binnen een organisatie kan een grote verandering zijn, maar de voordelen zijn aanzienlijk. Hier zijn 6 stappen die u kunt nemen om uw organisatie...
Ten eerste, gefeliciteerd met het afronden van de Tableau Desktop 2-training! Dit is een belangrijke mijlpaal in je reis om een Tableau expert te worden. Om in de goede...
Datavisualisatie heeft de afgelopen jaren een lange weg afgelegd en de toekomst ziet er nog rooskleuriger uit. Aangezien data in een ongekend tempo blijft groeien, zal het vermogen om...

Het kan soms handig zijn om een dynamische crosstab of tabel te hebben waarbij je kunt schakelen tussen dimensies én table calculations. Het probleem is alleen dat de table...
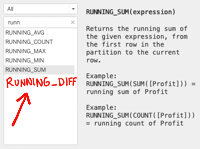
Have you ever encountered the need to calculate the difference in a measure row compared to the value of the previous row? This is called a Running Difference. A...
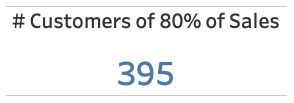
Have you ever had the need to create a KPI that represents the # of *dimension* that represents the X% of a *measure*. For example: This happened to a...
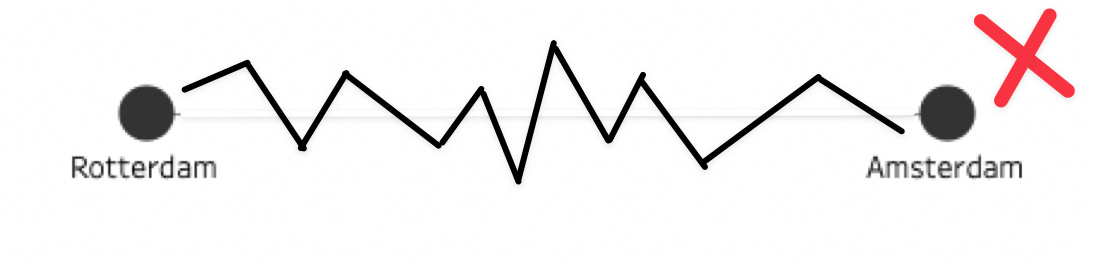
Network graphs are a specific visualization that helps you to analyze interactions and connections between entities. Although network graphs are a powerful chart type they have their limitations. Depending...