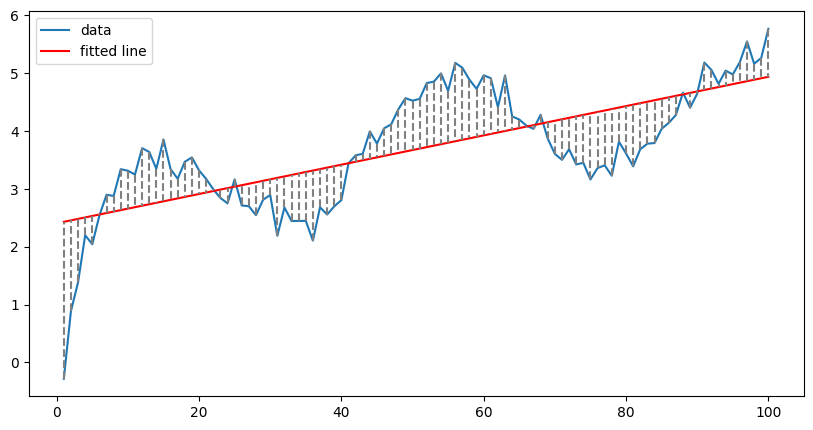
How do you fit non-linear data with a linear model? Using splines is one option. A simple explanation.
Sometimes the end result of your data prepping needs to be a JSON. This can be the case when for instance you need to upload your data to a...

Alteryx is een geweldige tool waarmee je gemakkelijk en snel data kunt opschonen, transformeren en analyseren. Als gebruiker hoef je niet te coderen. Hierdoor kunnen veel verschillende gebruikers, van...

Tableau Desktop is een krachtige tool voor data-analyse en visualisatie die veel wordt gebruikt in de zakelijke wereld. Het kan echter intimiderend zijn om te beginnen met het gebruik...

Adding a splash color to highlight data on a table can greatly amplify cognition. Tables are one of the most common ways to visualize data still. (Even though it...
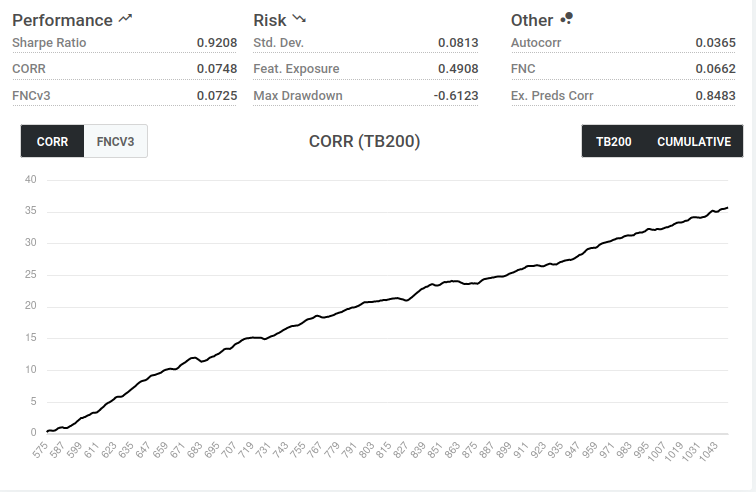
Introductory tutorial to using snowflake for participating in the Numerai tournament

A brief overview of the Snowpark functionality, that allows one to write python code on a Snowflake data warehouse.
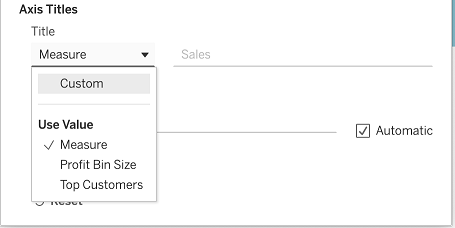
Data visualization is a crucial aspect of modern data analysis, and Tableau has long been a go-to tool for creating beautiful and informative visualizations. With the release of Tableau...
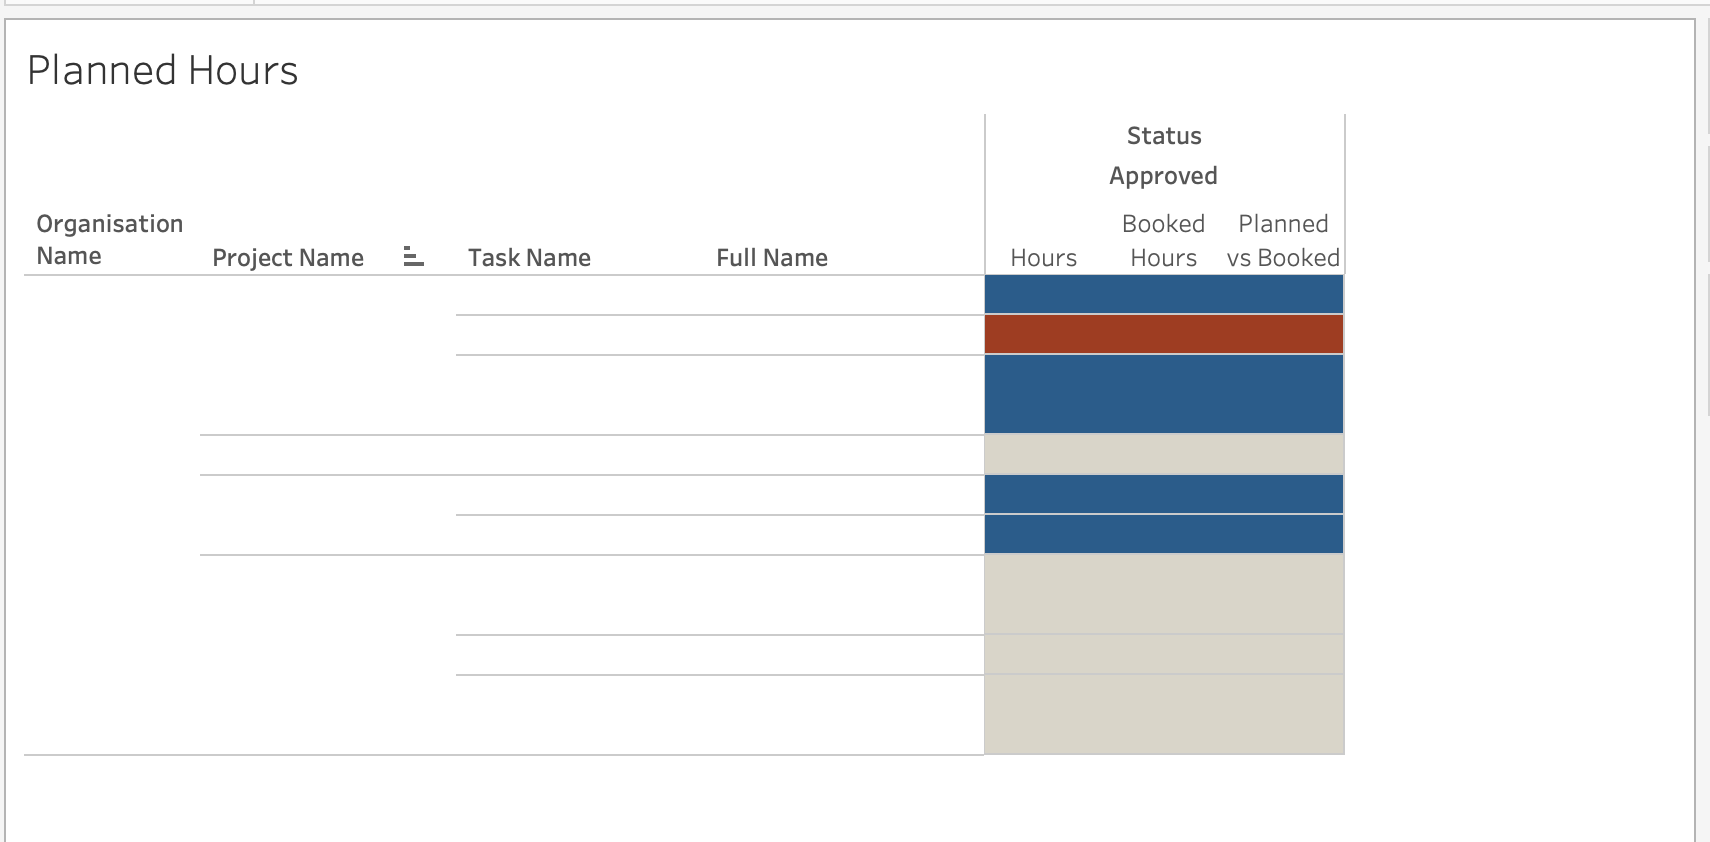
Tableau is a powerful data visualization tool that can help you create insights quickly and easily. While it can be daunting to start with Tableau, especially when looking at...