

Imagine you’re creating a chart and you want to add a certain shape or icon that is not available in Tableau’s default shape palette. For example, what if you...
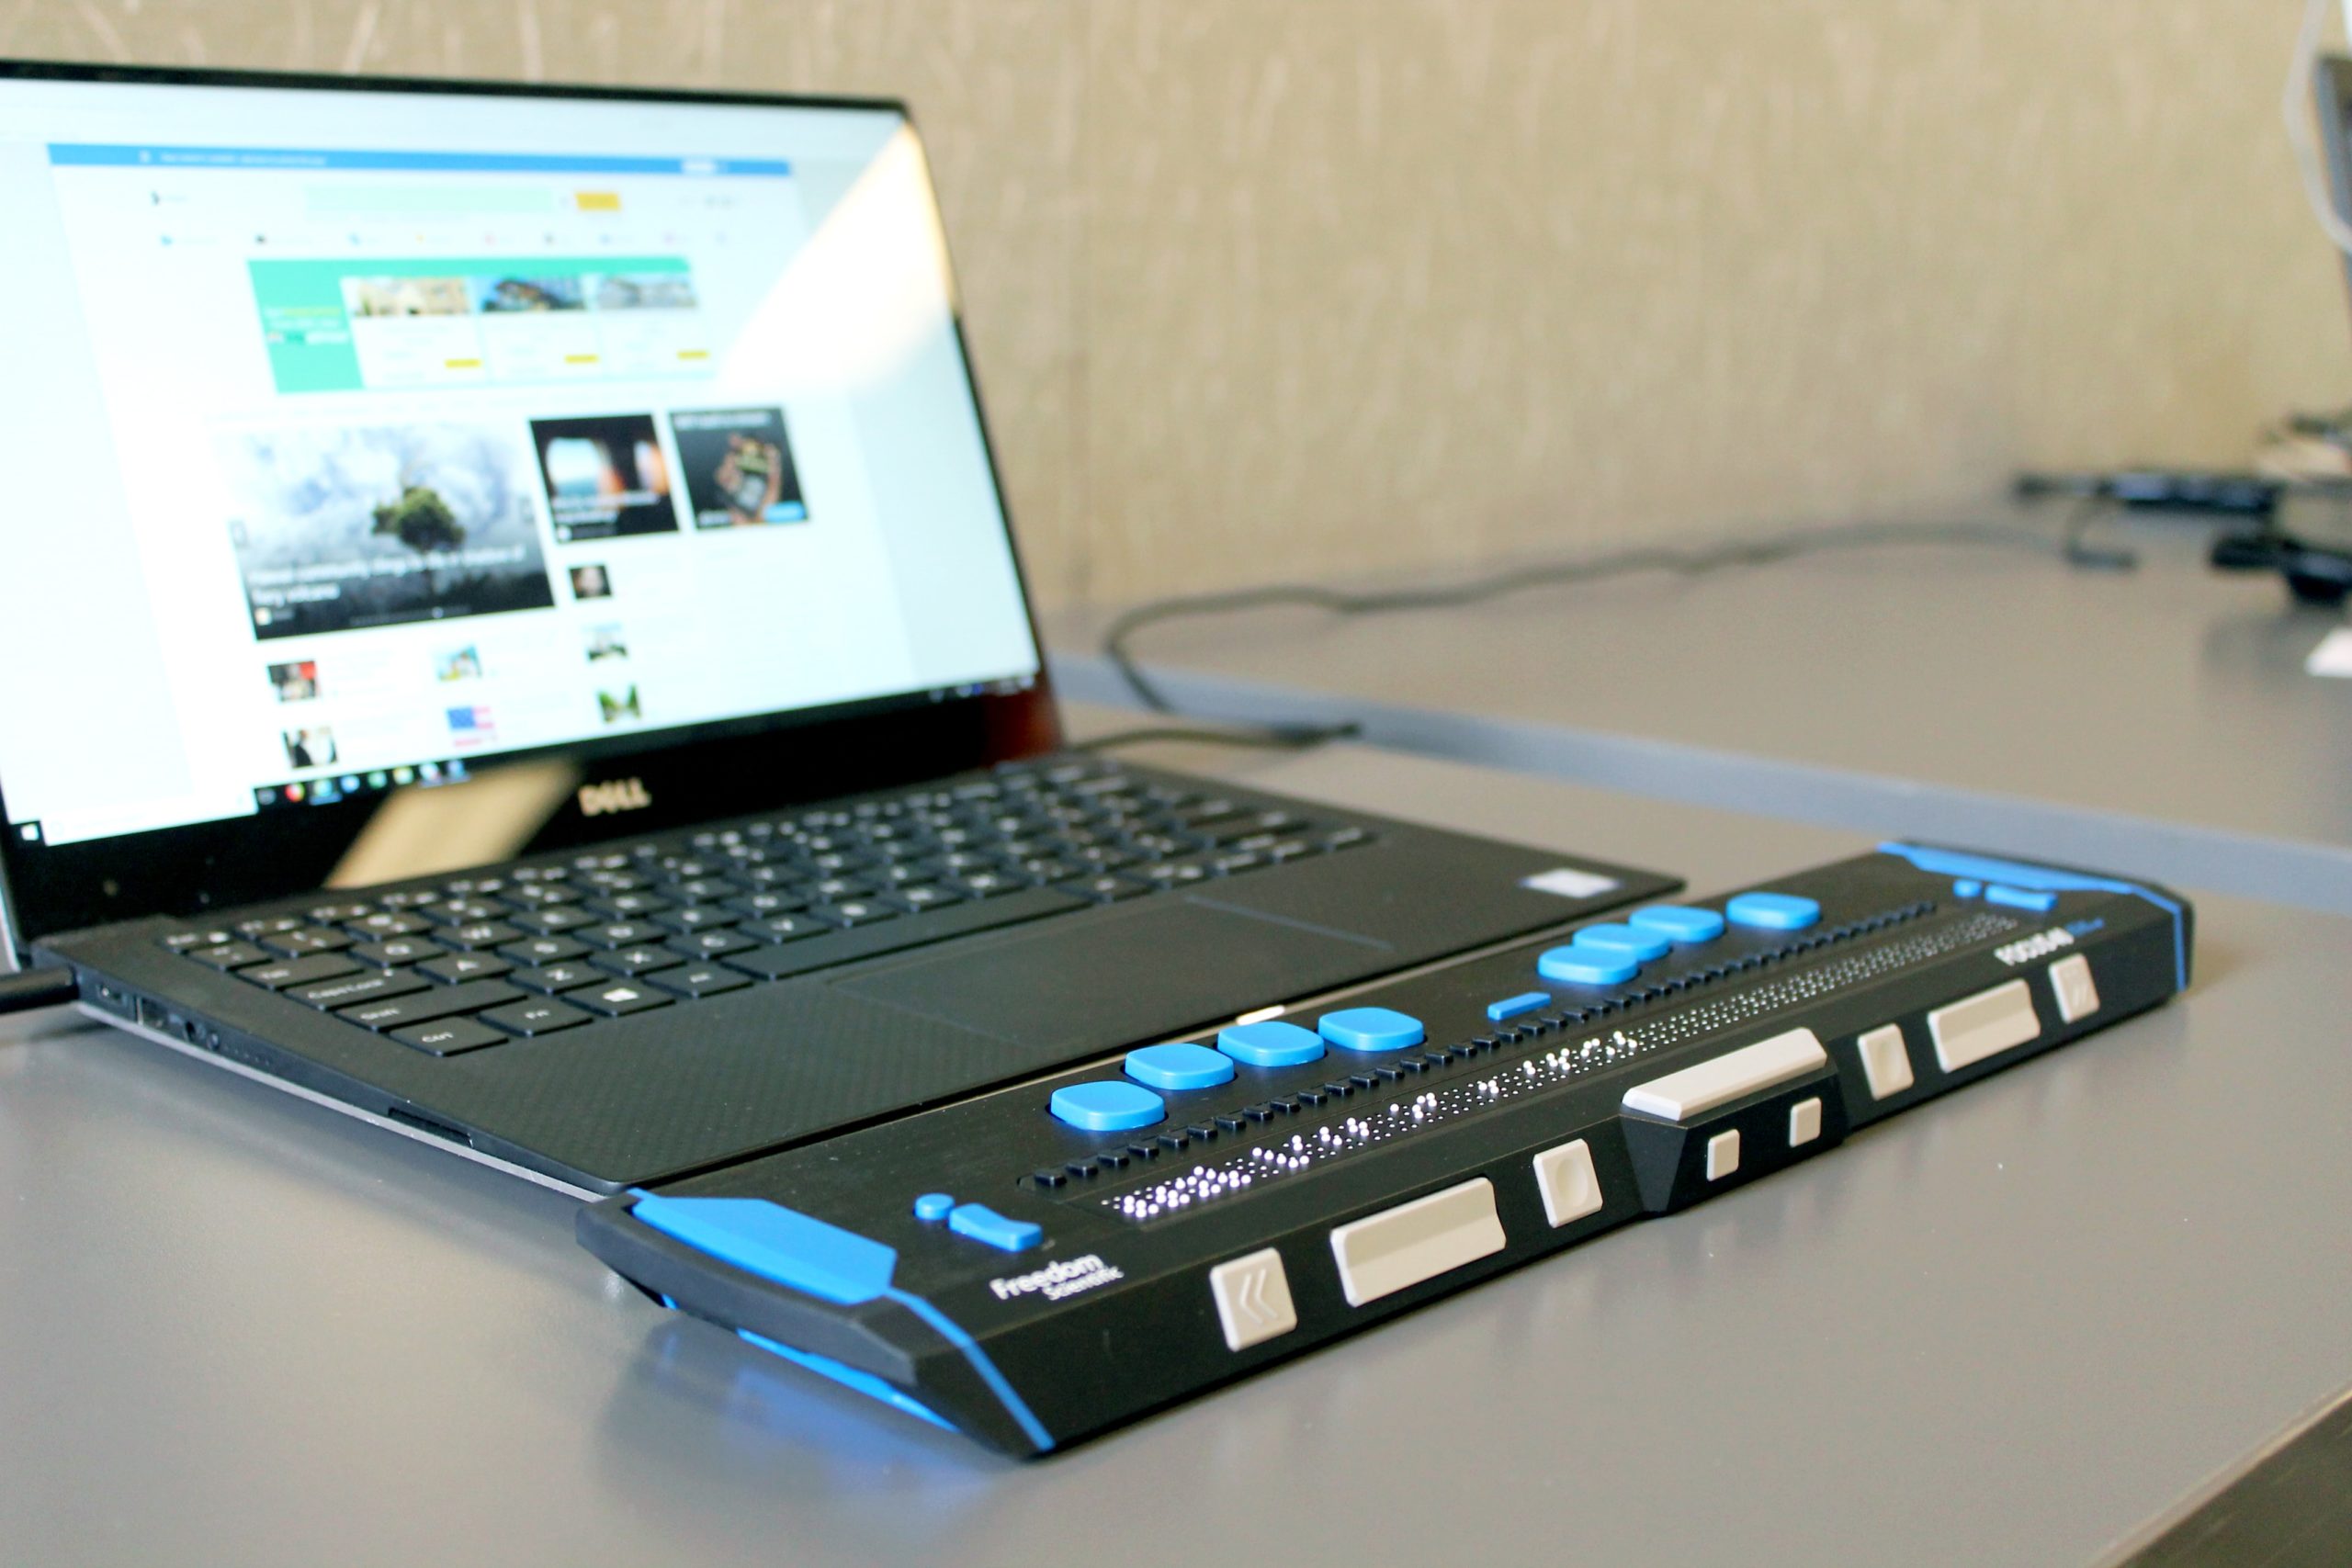
In a time where data-driven decisions shape our world, it’s crucial that data visualisations are accessible to everyone. Many BI tools offer a wide range of features to ensure...

Introduction The Dynamic Zone Visibility feature in Tableau has been around for almost a year from today and there are a lot of different use cases on how they...
TC23, de Tableau conferentie van dit jaar, is alweer even achter de rug. Zo’n 8000 leden van de #DataFam kwamen samen in de wonderlijke wereld die Las Vegas heet....
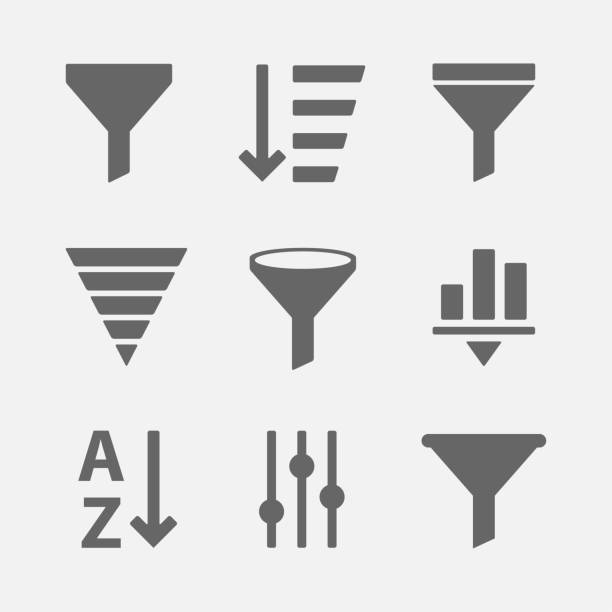
Less is more. As data analysts we don’t want to see tables with dozens of columns and millions of rows! We just want to see a visual summary. But...

Stel dat er een dashboard moet komen waarin te zien is viel hoeveel uur er per rol/functie in een project besteed werd. Het dashboard moest laten zien wat het...
Hoe houd je de afdelingen HR, die gewerkte uren per maand, en Financiën, die alles met ISO wil zien, tevreden? Oftewel hoe krijg ik gewerkte uren in maanden en...
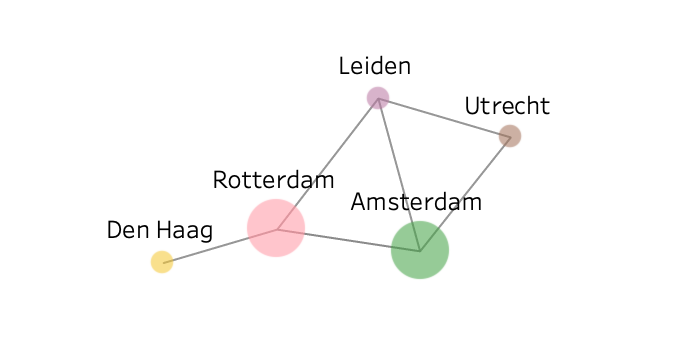
A network graph (also known as a link chart, a node-link diagram, a network map, or just a graph) represents a collection of interlinked entities. This type of graph...
Wanneer je al enige tijd met data werkt zul je waarschijnlijk meerdere dashboards gezien hebben, of zelfs gemaakt. Het kan zo zijn dat je het begrip dashboard en hoe...