
In this series, I will explore how compositions are different from comparisons, and what chart types you can use to visualise a composition. Start at Part 1 here.
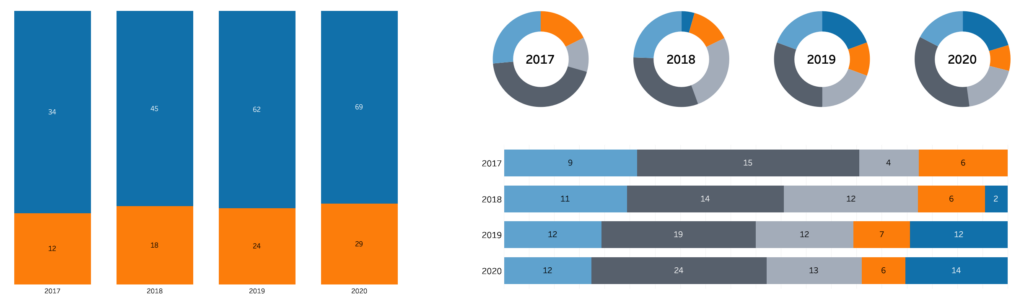
We’ve been looking at ways to visualise the composition of library data, using stacked bar charts and pie charts. We visualised genres and sections (the parts) in relation to the bigger whole (all of the books in my library):
For simplicity’s sake, we have been ignoring part of our data structure. It’s high time we bring that back.
Hierarchical data
Our library data is organised into Sections (fiction versus non-fiction) and Genres (Romance, mystery, memoirs, and so on), but this is not the only part-to-whole relationship in our data. Sections and Genres represent a part-to-whole relationship on their own: Genres are parts organised into Sections, which in turn are parts of the whole of my data — there is a hierarchy or tree structure to my library:
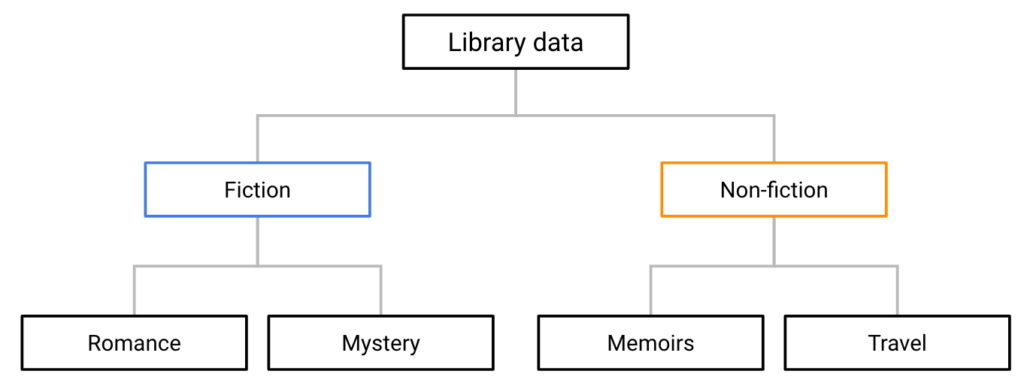
A good visual representation of a hierarchy should make this structure clear — I want to see parts of wholes that are parts of wholes.
Visualising trees: Treemaps
One way to visualise a tree structure is with a treemap. Here’s a treemap of my library data:
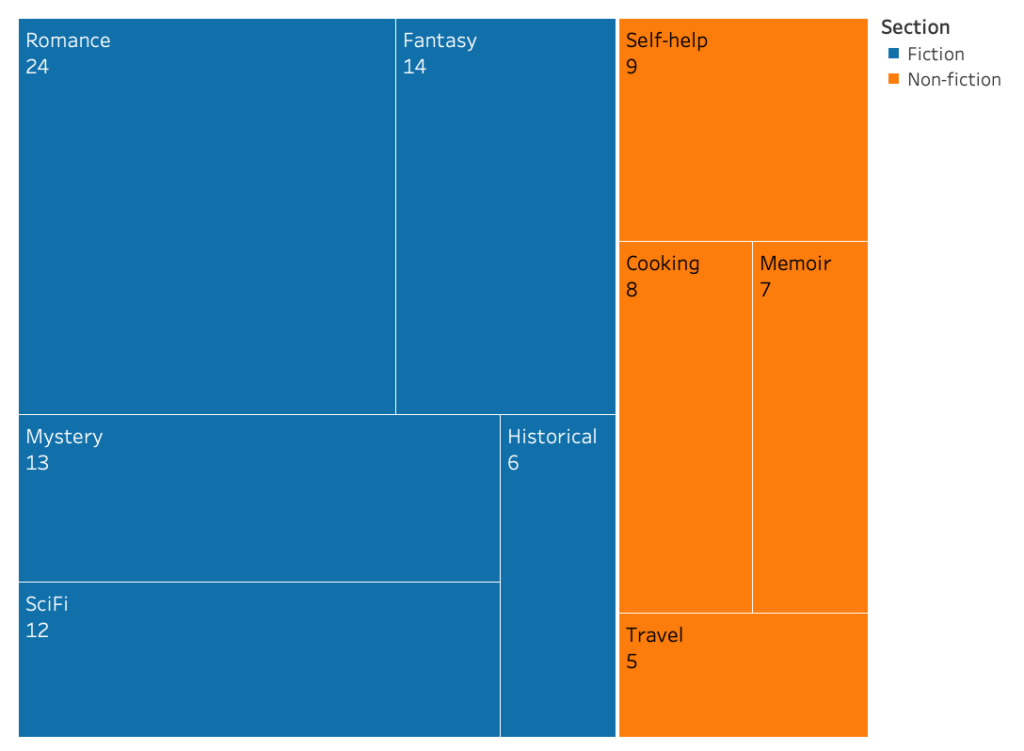
That… could almost be a bookcase. In fact, if I were to use the template to build a bookcase I wouldn’t be too far off: the size of the areas corresponds to the number of books in that category. I can see that my Genres are neatly sorted (nested) into Sections, and that both Sections in turn make up the whole of the bookcase.
To read the treemap, we start at the top-left. This position will display the bigger Section, in this case, Fiction. Within that Section, the top-left again displays the biggest Genre, in this case, Romance. Going down all the way to the bottom-right, we find the smallest Genre in the smallest Section: Travel books.
Building a treemap
Treemaps are not unlike stacked bar charts conceptually, and they are created in much the same way in Tableau. To create a treemap, we need at least two categorical dimensions (such as Section and Genre) and a measure (such as Number of Books).
Our first step is to identify the dimension of the highest level — Section, in our case. Drag this dimension onto Colour. Next, identify the measure — Number of Books. Drag this onto Size. This shows the contribution of the different Sections to the whole, but we also want to see the contribution of the different Genres to the Sections. Identify the dimension you want to see nested into the first dimension, Genre, and drag it onto Detail. Your treemap is now done!
It is very hard to read though. It might be a good idea to add some text to the rectangles to identify them at a glance. In the example above, I have added both Genre and Number of Books to Label, but you can customize this however you want.
Treemap dos and don’ts
Don’t use a treemap to show comparisons. Do use a treemap to show a composition.
Treemaps suffer from some of the same problems as pie charts: humans are just not very good at comparing areas. If part-to-whole is not your focus, use a bar chart instead. Not convinced? Ignore the label, and try comparing the number of SciFi to Mystery books in the map above.
Don’t use a treemap to show trends. Do use a treemap to show hierarchical compositions.
Related to the point above: judging the size of an area can be difficult enough, judging changes in size is even worse. Treemaps excel at showing hierarchical compositions though — side-by-side (stacked) bar charts simply cannot compete.
Don’t label every box. Do switch to tooltips instead.
You will find that some of the groups in your data might be quite a bit smaller than other groups, leaving a tiny area for any label to go. It’s not worth the visual clutter to label all areas, use tooltips instead. Tableau simply stops showing labels when the areas are too small to contain them, so this shouldn’t be an issue.
This was the final instalment in a series on part-to-whole visualisations. Start at Part 1 here. Or, have another look at building a stacked bar chart here, or why not to make a pie chart here.