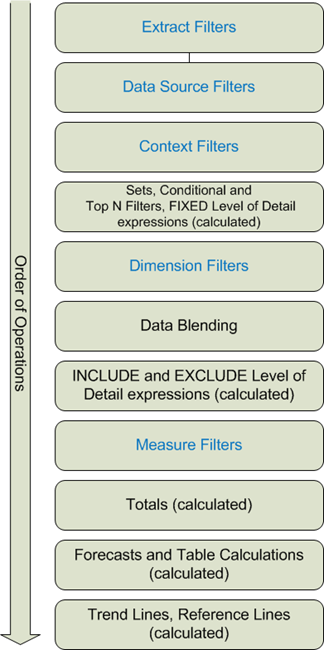
Working with filters and FIXED Level of Details Calculations (LODs) in the same view can be challenging. This is due to Tableau’s order of operations.
In general, if something in our view is not working quite the way we want it to and we have some filters on, the order of operations is a good place to start troubleshooting.
In our case, FIXED LODs are always calculated before Dimension filters. We can leverage this to make sure the view shows exactly what we want to see.

Our goal
In this post, we are going to use Tableau’s order of operations in order to solve an issue between our FIXED LOD and our filter.
Our goal is to achieve a view that:
- shows a percentage of total
- per each one of three segments, per state
- that doesn’t change if only one segment is selected
- independently of what is in the view.
Say that for the State of Nevada the segment values are: 15% – 5% – 80%.
Our goal is to allow users to select only the first segment from the filter and see the value for that segment for the state of Colorado: 15%.
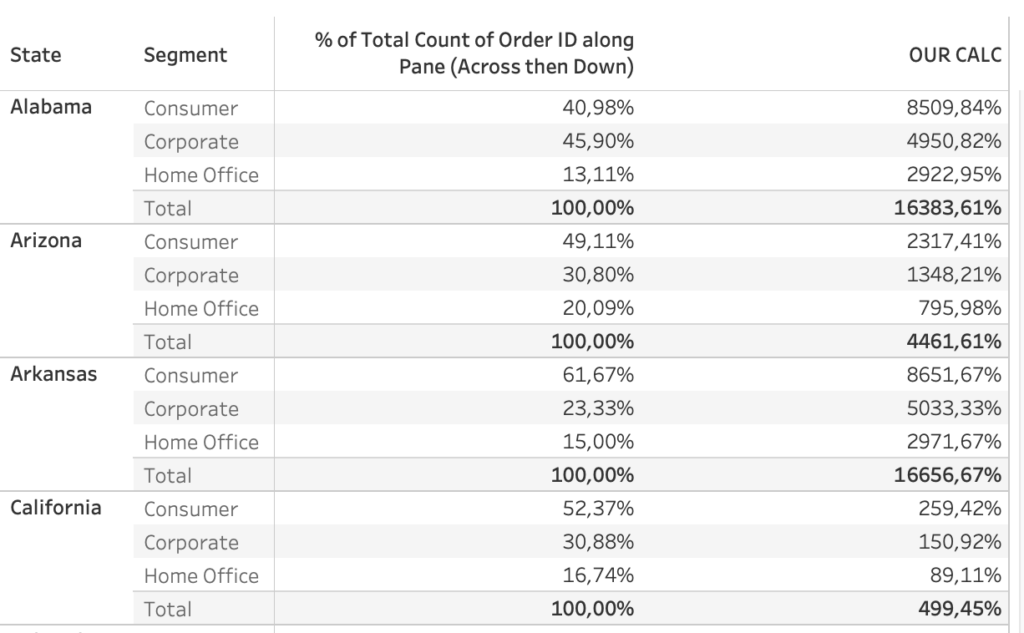
Using a Percentage of total Table calculation, and selecting compute over pane does the trick at the beginning. In fact, the segments will indeed show their respective 15% – 5% – 80% values. However, if one selects only one of the three segments, the calculation will change the value to 100%. This is because Tableau re-calculates the values to make sure to provide a percentage of total in the pane. With one element the total is indeed 100%.
In the video below, the % of Total column is our starting point, and the “OUR CALC” column is our goal:
So, how can we communicate with Tableau that we want the percentage to still refer to the percentage of total per State when we are selecting just one segment?
SOLUTION:
Whenever we want a calculated field to return something independently of the view, Level of Detail expression become our best friends.
For our solution, we are going to go ahead and use a FIXED Level of Detail expression that fixes the count of order id on both the State and the segment.
{FIXED [State], [Segment]: COUNT([Order ID])}
/
{ FIXED [State]: COUNT([Order ID])}
Because of the order of operations within Tableau, FIXED LODs are computed before dimension filters.
Adding a FIXED LOD forces Tableau to calculate the percentage of total before choosing which segment to display. This way, Tableau first calculates the percentages (15% – 5% – 80%), and when we choose segment A, it simply displays the first value, 15%, without further re-calculations.
N.B: In order to obtain the result, the default properties of the number format of the calculation we create needs to be set to Percentage.
Why add two dimensions in the FIXED calculation?
Let’s first look at what happens if we use only one of the two dimensions in the calculation.
Using only State:
{ FIXED [State]: COUNT([Order ID])}/{ FIXED [State]: COUNT([Order ID])}
If we use only State, Tableau will show the percentage of the count of order IDs per State. Of course, the total percentage of order IDs per each State will always be 100%. Not very useful for our purpose.

Using only segment:
{ FIXED [Segment]: COUNT([Order ID])}/{ FIXED [State]: COUNT([Order ID])}
If, on the other hand, we fix the calculation only to segment, something even stranger will happen:
- Tableau will calculate the total amount (count) of orders per segment across all cities (see [fixed on segment] column below)
- then turn it into a percentage (see [fixed on segment %] column below)
- and then divide it by the amount of orders per each State (see [OUR CALC] column below)

The two options above act like LODs and return values independently from what’s in the view, but not in the way we want. This is an example of how flexible LODs are, the trick is to fine tune them to our specific needs.
Do you want to learn more about Tableau, Alteryx or Snowflake? Do you want to use these tools to their full potential? Check out our trainings and consultancy services!

