
Today I would like to address how to combine the Transpose and Cross Tab tools. Both of these tools are powerful and they do (almost) the opposite of each other: the Transpose tool pivots the orientation of the table from horizontal to vertical, whereas the Cross Tab tool pivots it from vertical to horizontal.
So why would you use one after the other? Don’t they cancel each other out? In fact, temporarily pivoting the table in the “wrong” direction with the Transpose tool will allow you to utilize the Cross Tab tool not only to pivot the table back, but also to aggregate the rows. And this can turn out to be a handy trick to keep up your Alteryx sleeve! In this blog, I will give an example of when to use this combo, and explain why and how it works.
It’s Monday, and I decided to start the week with a simple Alteryx Weekly Challenge. I picked challenge #232, which focuses on the amount of face masks sewn by the Bastille St. community members are those sewn by a company called Butterfly. One data set is provided for each entity:
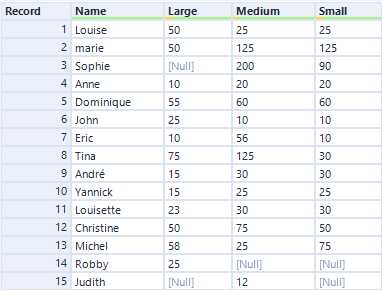

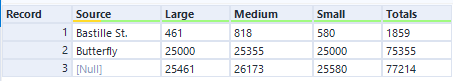
The goal is to “find the total number of masks produced by each group for each mask size and the total number of masks produced by each group”, and reproduce the result below: a source column with the name of the source table; “Large”, “Medium” and “Small” column, with data aggregated by Source; a “Totals” column and a total (sum) row.
How to use the Transpose and Cross Tab tools combo.
The situation here is this: the table is already in pivoted in the desired direction: both in the databases we are given and in the final results, “Large”, “Medium” and “Small” are columns. So why pivot the columns just to pivot them back again?
The answer is: because our goal is to aggregate the columns. More specifically, we would like to reduce the Bastille St. table to one line, where we are going to sum all the masks produced per type.
So here is how to achieve the goal:
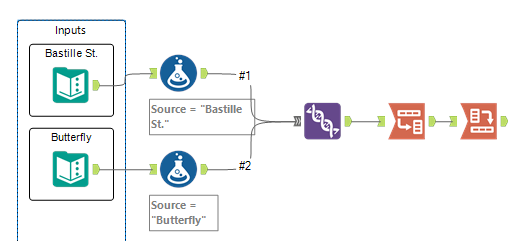
- Connect a Formula Tool to each table to add a “Source” column. We can achieve this by selecting Add new column and adding a string with the table name (‘Bastille St.’ and ‘Butterfly’) in the editor;
- Union the two tables;
- and then add the Transpose and Cross Tab tools combo.
Configure the Transpose and Cross Tab tools combo
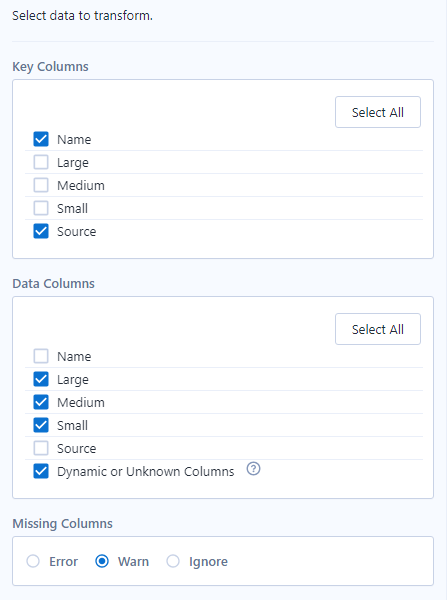
Add a Transpose tool. In the configuration window of the Transpose tool,
- select”Name” and “Source” under Key Columns, and
- select the rest of the columns under Data Columns.
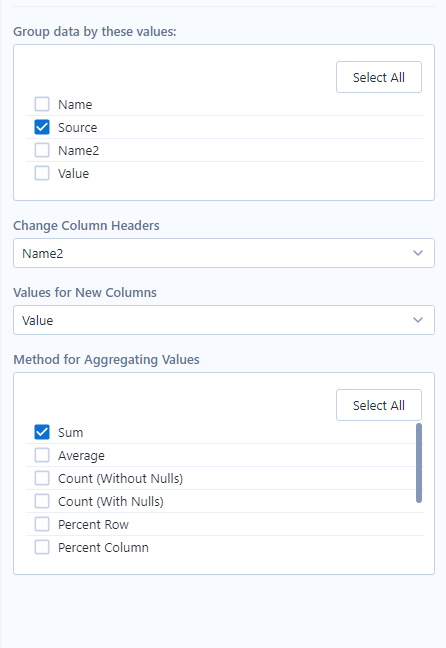
Connect the Transpose tool to a Cross Tab tool. In the configuration window of the Cross Tab tool,
- select “Source” under Group data by these values;
- choose the newly pivoted “Name2” columns under Change Column Headers, so as to restore “Large”, “Medium” and “Small” as headers;
- “Value” under Values for New Columns;
- and finally, under Method for aggregating Values, choose Sum, Total Column and Total Row.
And that’s it! You will have pivoted your dataset back to where it started, and added three aggregations just by combing the Transpose and Cross Tab tools.
I’d like to conclude with a comment on Alteryx Challenges. The Weekly Challenges are a really good place to grow, as many users share their results underneath the challenge. It’s fun to see how many different, more or less complicated ways there are to achieve the same result! Even after solving the challenge, I like to check out other solutions, to see whether someone came up with a more elegant or efficient one. For this week, I would like to give credit to Philip Mannering, whose solution inspired this blog.
If you would like to tackle the challenge yourself, you can find the instructions, datasets and solutions here. Happy learning!
Wanna learn more about Tableau or Alteryx? Do you want to use these tools to their full potential? Check out our trainings and consultancy services!