
In this map of The Netherlands, you can choose to see the number of inhabitants by either Districts or City. Did I use two sheets to create this map? No, I used only one sheet, one parameter and two calculated fields.
[tableau url=”https://public.tableau.com/views/Blogpost-HowtoSwapGeometries/Dashboard1?:embed=y&:display_count=yes&publish=yesfl?:embed=y&:display_count=yes” width=”560px” height=”750px”][/tableau]
I used two shapefiles from www.cbs.nl and joined them in Tableau.
- Let’s start with the parameter: Set the data type to ‘string’, choose ‘list’ and create two values: ‘City’ and ‘District’
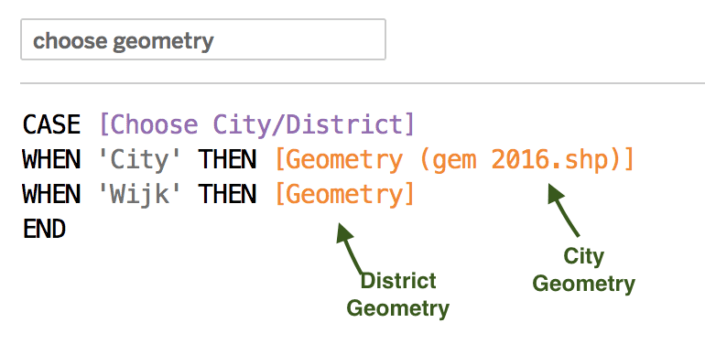
- First calculated field: ‘choose geometry’, based on the parameter, it allows swapping between the two geometries (City and District in our case)
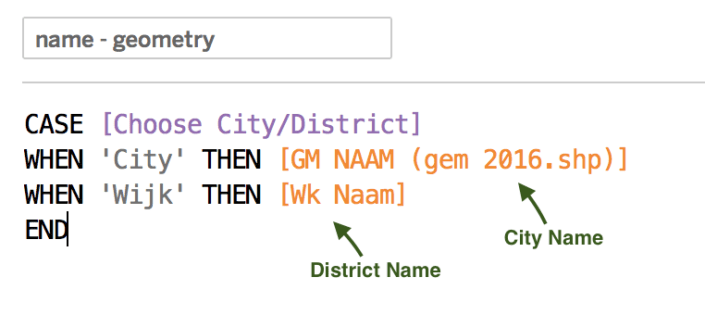
- Second calculated field: ‘name geometry’, based on the parameter, it set the dimension related to the geometry.
Following steps:
- Double click on the calculated field ‘choose geometry’
- Add the field ‘name geometry’ to Detail
- Drag the measure ‘Number of inhabitants’ to Color
- Show Parameter Control
Do you want to learn more about Tableau or Alteryx? Do you want to use these tools to their full potential? Check out our trainings and consultancy services!